Bazopuzomer 1.03 & Basemer 8.2 for 1C:Enterprise 8.X
Content: text (0 symbol)
Uploaded: 29.12.2025
Positive responses: -1
Negative responses: 0
Sold: -1
Refunds: -1
Seller: Cyfra+
information about the seller and its items
Loyalty discount! If the total amount of your purchases from the seller more than:
| $5 | the discount is | 3% |
| $15 | the discount is | 5% |
| $50 | the discount is | 7% |
| $100 | the discount is | 10% |
| $300 | the discount is | 29% |
$1
“Bazopuzomer” is a convenient report for 1C:Enterprise that helps you evaluate the real volume of data in an information database and the load on the system. The solution works on the 1C platform starting from version 8.2, in any configuration, and supports all interfaces: standard, managed, and Taxi.
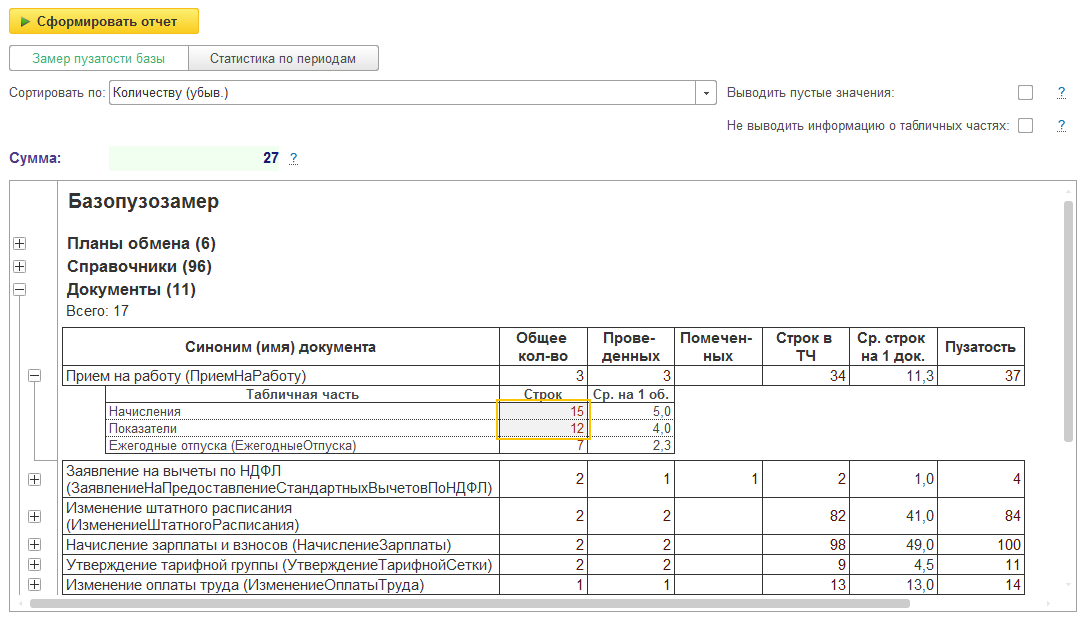
The report analyzes all major metadata types (catalogs, documents, registers, and other objects) and shows statistics for the number of items, rows in tabular sections, and the average “density” of data for each object. For every object, its “fatness” is calculated, meaning the total number of rows in all tabular sections plus the number of items of the object itself.
The tool is useful for administrators, analysts, and developers when it is necessary to:
estimate the volume of stored data before migrating a database to a new edition or a new server;
calculate the required resources for deploying new databases;
define metrics for performance evaluation;
plan or develop resource‑intensive subsystems that are demanding in terms of data volume and structure.
The report allows you to:
get the number of objects and the number of rows in their tabular sections;
calculate the average number of rows per object;
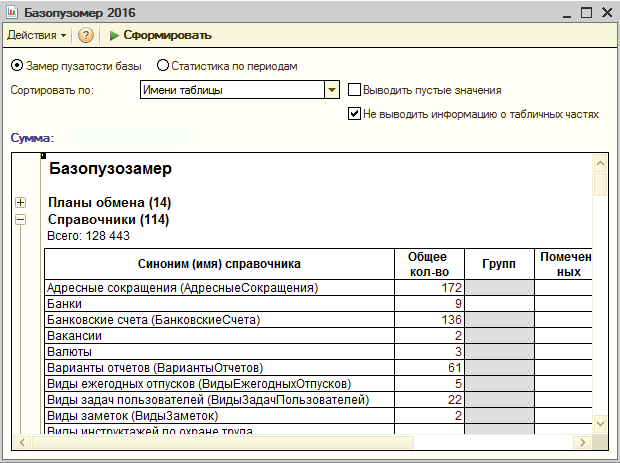
take into account the number of groups for hierarchical and non‑hierarchical catalogs and characteristic type plans (for non‑hierarchical objects the corresponding cells are shown shaded);
quickly view data for each object by opening its list form with a click on the name;
choose sorting by name, synonym, or number of items for each object type (ascending or descending).
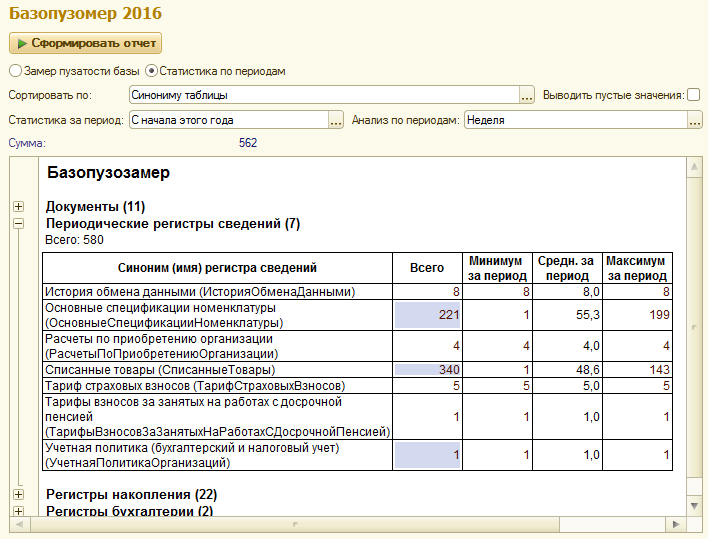
A separate period‑based report makes it possible to analyze the dynamics of database filling over any selected time interval. You can evaluate the total volume of data and the intensity of its growth by days, weeks, ten‑day periods, months, or quarters. The report includes:
documents;
business processes and tasks;
accumulation, accounting, and calculation registers;
periodic information registers.
Base Meter 8.2 is an external report on database contents. It shows the number of objects (catalogs, documents, reports, data processors, etc.). It generates the configuration database structure as a tree view, and for specific configuration objects, you can view the DBMS fields and indexes. It works only in the thin client.
The data processor is universal and will work in any configuration, but only in the thin client; it might also launch in the web client. Tabs for accounting registers and constants have been added.
The report analyzes all major metadata types (catalogs, documents, registers, and other objects) and shows statistics for the number of items, rows in tabular sections, and the average “density” of data for each object. For every object, its “fatness” is calculated, meaning the total number of rows in all tabular sections plus the number of items of the object itself.
The tool is useful for administrators, analysts, and developers when it is necessary to:
estimate the volume of stored data before migrating a database to a new edition or a new server;
calculate the required resources for deploying new databases;
define metrics for performance evaluation;
plan or develop resource‑intensive subsystems that are demanding in terms of data volume and structure.
The report allows you to:
get the number of objects and the number of rows in their tabular sections;
calculate the average number of rows per object;
take into account the number of groups for hierarchical and non‑hierarchical catalogs and characteristic type plans (for non‑hierarchical objects the corresponding cells are shown shaded);
quickly view data for each object by opening its list form with a click on the name;
choose sorting by name, synonym, or number of items for each object type (ascending or descending).
A separate period‑based report makes it possible to analyze the dynamics of database filling over any selected time interval. You can evaluate the total volume of data and the intensity of its growth by days, weeks, ten‑day periods, months, or quarters. The report includes:
documents;
business processes and tasks;
accumulation, accounting, and calculation registers;
periodic information registers.
Base Meter 8.2 is an external report on database contents. It shows the number of objects (catalogs, documents, reports, data processors, etc.). It generates the configuration database structure as a tree view, and for specific configuration objects, you can view the DBMS fields and indexes. It works only in the thin client.
The data processor is universal and will work in any configuration, but only in the thin client; it might also launch in the web client. Tabs for accounting registers and constants have been added.
The “Statistics by periods” report calculates:
the total number of data items for the selected period;
the minimum, average, and maximum number of data items per day, week, ten‑day period, month, or quarter within the analyzed interval.
For convenient work, interactive summation is implemented: you just select any arbitrary range of cells in the report, and the system instantly calculates the total values for the chosen indicators. Summation is available for all values that are marked in the report with a dark brown color.
Version 1.03 dated 11.12.2016 includes a fix for an error in determining the number of register records in cases where an attribute or resource is an unlimited‑length string or a value storage. Thanks to this, the report correctly processes complex data structures and accurately counts records in registers.
The solution has been tested on a number of popular 1C configurations, which confirms its reliability in real‑world use (Enterprise Accounting 2.0 and 3.0, Payroll and HR Management 2.5 and 3.1, Complex Automation 2, Our Company Management 1.6, Trade Management 11, with the actual releases available at the time).
Immediately after payment, the buyer automatically receives a download link to an archive containing the report named “Bazopuzomer”. The archive includes the required report file, which can be connected to your 1C database so you can start analyzing data right away.
No feedback yet