DHS 19.2 - Option 8. Decisions Ryabushko AP
Content: 8v-IDZ19.2.pdf (72.33 KB)
Uploaded: 10.07.2025
Positive responses: 0
Negative responses: 0
Sold: 8
Refunds: 0
Seller: Massimo86
information about the seller and its items
Loyalty discount! If the total amount of your purchases from the seller more than:
| $3 | the discount is | 1% |
| $6 | the discount is | 2% |
| $9 | the discount is | 3% |
| $12 | the discount is | 4% |
| $15 | the discount is | 5% |
| $18 | the discount is | 6% |
| $20 | the discount is | 7% |
| $30 | the discount is | 10% |
$1.4
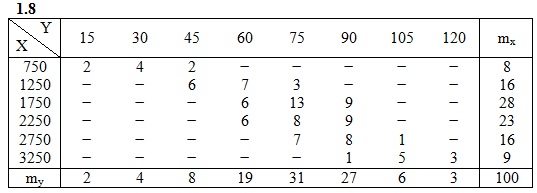
Dana allocation table 100 factories manufacturing facilities X (thousand. Den. Units.) And daily output Y (t). It is known that there is a linear correlation between X and Y. Requires:
a) find the equation of the regression line y on x;
b) build the empirical equation of the regression line and random sampling point (X, Y).
a) find the equation of the regression line y on x;
b) build the empirical equation of the regression line and random sampling point (X, Y).
Detailed solution. Designed in PDF format for easy viewing of IDZ solutions on smartphones and PCs. In MS Word (doc format) sent additionally.
No feedback yet